
What Is Fault Tree Analysis (FTA)?
Fault tree analysis (FTA) is a method for examining one undesired state of a system. The analyst defines that state first, for example the failure of a main engine, and then works backwards to identify every realistic combination of faults that could produce it. The result is a logic diagram in the form of a tree, with the undesired state at the top and the faults that can cause it branching downwards.
FTA is used mainly in safety and reliability engineering: to understand how a system can fail, to identify the most effective ways to reduce risk, and to estimate how often an accident or system-level failure is likely to occur. It has been adopted in aerospace, nuclear power and the chemical process industry, and it has been used in software safety. It is also one of the methods listed in ICH Q9, the quality risk management guideline for pharmaceuticals issued by the International Council for Harmonisation (ICH), formerly the International Conference on Harmonisation.
This guide covers what defines the method, the structure of a fault tree, how a tree is built and what it reveals, how FTA compares with other methods, its use in functional safety, its limits, and its origin in the Minuteman missile programme.

What defines the method
Two features define FTA.
- It is deductive. It begins with an outcome and reasons backwards to its causes. Inductive methods do the opposite: they begin with a component fault and reason forwards to its effects.
- It is failure-based. It models how a system fails, and the tree records the logical conditions under which that failure occurs.
A safety analysis can therefore begin from one defined undesired outcome and work backwards through logic to the combinations of faults that produce it, instead of beginning with the components and asking what each one's failure might do. This is what makes FTA a distinct method rather than a variant of component-level failure analysis.
The structure of a fault tree
A fault tree is built from one top event, the events that can cause it, and the gates that connect them.
The top event
The undesired state at the root of the tree is the top event. A single fault tree analyses one top event only. In aerospace, top events are called system failure conditions and are classified by the severity of their effects; the most severe conditions receive the most extensive analysis, and the conditions themselves are usually defined earlier, during functional hazard assessment.
Basic events and gates
Below the top event sit the events that can cause it. The events at the base of the tree are basic events: hardware failures, human errors, software errors or any other relevant event. Each event is treated as binary: it has either occurred or it has not.
Events are joined by gates. Each gate symbol states the logical relationship between the input events beneath it and the output event above it. The two basic gates are OR and AND. Apart from the dynamic gates of dynamic fault trees, the other gates are special cases of these; three are listed after the two basic gates:
- OR gate: the output event occurs if at least one input event occurs. Any single input is sufficient.
- AND gate: the output event occurs only if all input events occur. Every input is necessary.
- Exclusive OR gate: the output event occurs if exactly one input event occurs.
- Priority AND gate: the output event occurs only if the input events occur in a specific sequence, set by a conditioning event.
- Inhibit gate: the output event occurs if the input event occurs while an enabling condition, set by a conditioning event, holds.
A worked illustration
Consider a metal stamping press where the top event is a person's hand being stamped. Working backwards, the harm can occur during normal operation or during maintenance: an OR gate. Within normal operation it could harm the operator or another person: a further OR gate. A design change requiring the operator to press two separate buttons to cycle the machine appears in the tree as an AND gate, because both buttons must be pressed before the press cycles. Each button has its own failure rate, which can itself be analysed. The tree shows both where the hazard can arise and where a design change alters the logic.
What a fault tree does not claim
A fault tree is not a model of every way a system can fail. It is specific to one top event and includes only the faults that contribute to that event. Nor is it exhaustive: it covers only the faults the analyst assesses to be realistic.
How a fault tree is built
With that structure in mind, the National Aeronautics and Space Administration (NASA) Fault Tree Handbook sets out eight steps for a fault tree analysis:
- Identify the objective of the analysis.
- Define the top event.
- Define the scope of the analysis.
- Define the resolution: the level of detail the tree goes down to.
- Define the ground rules.
- Construct the tree.
- Evaluate the tree, qualitatively and quantitatively. The next section describes what the evaluation produces.
- Interpret and present the results.
What a fault tree reveals
Evaluating a tree (step 7) yields the following.
Cut sets
A cut set is a combination of basic events that together can cause the top event. A minimal cut set is a cut set from which removing any one event means the top event no longer occurs. Minimal cut sets are the compact statement of how the top event can occur. A minimal cut set containing a single event identifies an event that causes the top event on its own; larger sets show the combinations that must coincide.
Common cause
Cut sets that require two or more events to coincide, as a redundant arrangement does, can be defeated by a common cause failure: the failure of two or more components, at the same time or within a short interval, due to a common cause. In a fault tree, common cause failure accounts for dependencies that the tree does not model explicitly as events. Neglecting common causes can significantly underestimate the probability of the top event. In functional safety modelling, a common cause failure that defeats a redundant arrangement is shown by an OR gate added alongside the AND gate representing the redundancy, so that one cause can fail both channels at once.
Quantification
A fault tree is a qualitative model that can be, and often is, evaluated quantitatively. Once the basic events carry failure probabilities (where specific failure data do not exist, generic data can be used to estimate them), software calculates the probability of the top event and ranks the contribution and importance of each cause. The ranking shows which causes dominate, and where safety or reliability effort is best spent.
Uses of the results
Beyond estimating a probability, a fault tree is used to show compliance with safety or reliability requirements, to identify critical components, and to diagnose the causes of an observed failure. It applies both to a system being designed and to one already in operation.
How FTA compares with other methods
FTA is normally used alongside other methods. Three groups are compared here.
Failure mode and effects analysis (FMEA)
FMEA is inductive: it begins with a single component or function failure and traces its effect on the equipment or system. FTA is deductive. The two are complementary: the deductive approach focuses the analysis on the undesired event, while the inductive approach helps ensure that the analysis is broad enough to encompass all possible scenarios. FMEA analyses single component faults and their system effects, but it does not consider combinations of component faults. In civil aircraft safety assessment, an FMEA is usually the source document for the primary failures and other events in the fault tree.
Event trees
An event tree is inductive: it starts from an initiating event, such as a pipe rupture, and follows the possible subsequent events forward to a range of final consequences, where a fault tree works backward from one top event. The two are used together in probabilistic risk assessment.
Reliability block diagrams and Markov models
A fault tree can be converted into its logical opposite, a success tree, which shows the conditions that, if assured, guarantee that the undesired event does not occur. A reliability block diagram is similarly success-oriented: it represents the system by its success paths through its elements. The underlying Boolean logic is equivalent to a fault tree's: elements in series correspond to OR gates, and redundant elements in parallel correspond to AND gates. Markov models describe how a system moves between states as failures, repairs and tests occur. Fault trees and reliability block diagrams are static, logical (Boolean) models, while Markov models are dynamic.
Fault tree analysis in functional safety
The same equivalence appears in functional safety, where FTA belongs to the family of Boolean models used to calculate the probability of failure of a safety function, alongside reliability block diagrams. IEC 61508-6 is Part 6 of the International Electrotechnical Commission (IEC) functional safety standard IEC 61508 and gives guidelines on applying Parts 2 and 3. It treats a fault tree as equivalent to a reliability block diagram on that basis, and refers to IEC 61025, the international standard on FTA, for the method itself. Top-down steps in such a tree run, for example, from the safety-related system failing, to a sensor failing, to one particular sensor failing.
A typical example models the failure of a fire-water deluge system. The top event, the deluge failing, sits above an OR gate whose inputs include failure of the pump, of the motor, of fire detection and of power. Power failure requires the failure of both power sources, so it appears beneath an AND gate.
In safety integrity level (SIL) determination
FTA is also used in SIL determination where layer of protection analysis (LOPA) becomes cumbersome. This can be the case when a safety function mitigates in some operating conditions but not others, or when elements of the analysis are correlated, for instance when alarm response is a valid protection layer only while a plant is manned. Two approaches are used:
- Safety function left out of the tree. The tree calculates the unmitigated event frequency, and from it the risk reduction the safety function must provide.
- Safety function included as a protection layer. Its probability of failure on demand is treated as an unknown and back-calculated by setting the top event frequency equal to the tolerable frequency. This approach suits cases where the function does not mitigate in every situation the tree models.
Because a fault tree depends on large amounts of input data and on assumptions made by the analysis team during construction, both must be recorded so that the analysis can be justified and traced. One way is to number every element in the tree and keep a separate list of the data and assumptions for each.
Limits of fault tree analysis
These limits are properties of the method itself, not defects in a particular tree:
- A fault tree analyses one top event, so several undesired outcomes require several trees.
- It contains only the faults the analyst assesses to be realistic.
- Where specific failure data do not exist, the quantitative results rest on generic data.
- Neglecting common cause contributions can significantly underestimate the probability of the top event.
FTA is used alongside inductive methods such as FMEA, not in place of them: in the NASA handbook's words, "both deductive and inductive approaches must be employed to get a complete set of accident sequences".
Origin: the Minuteman launch control study
FTA was conceived at Bell Laboratories around 1961 by H. A. Watson, working with A. Mearns, under a United States Air Force contract to study the launch control system of the Minuteman intercontinental ballistic missile.
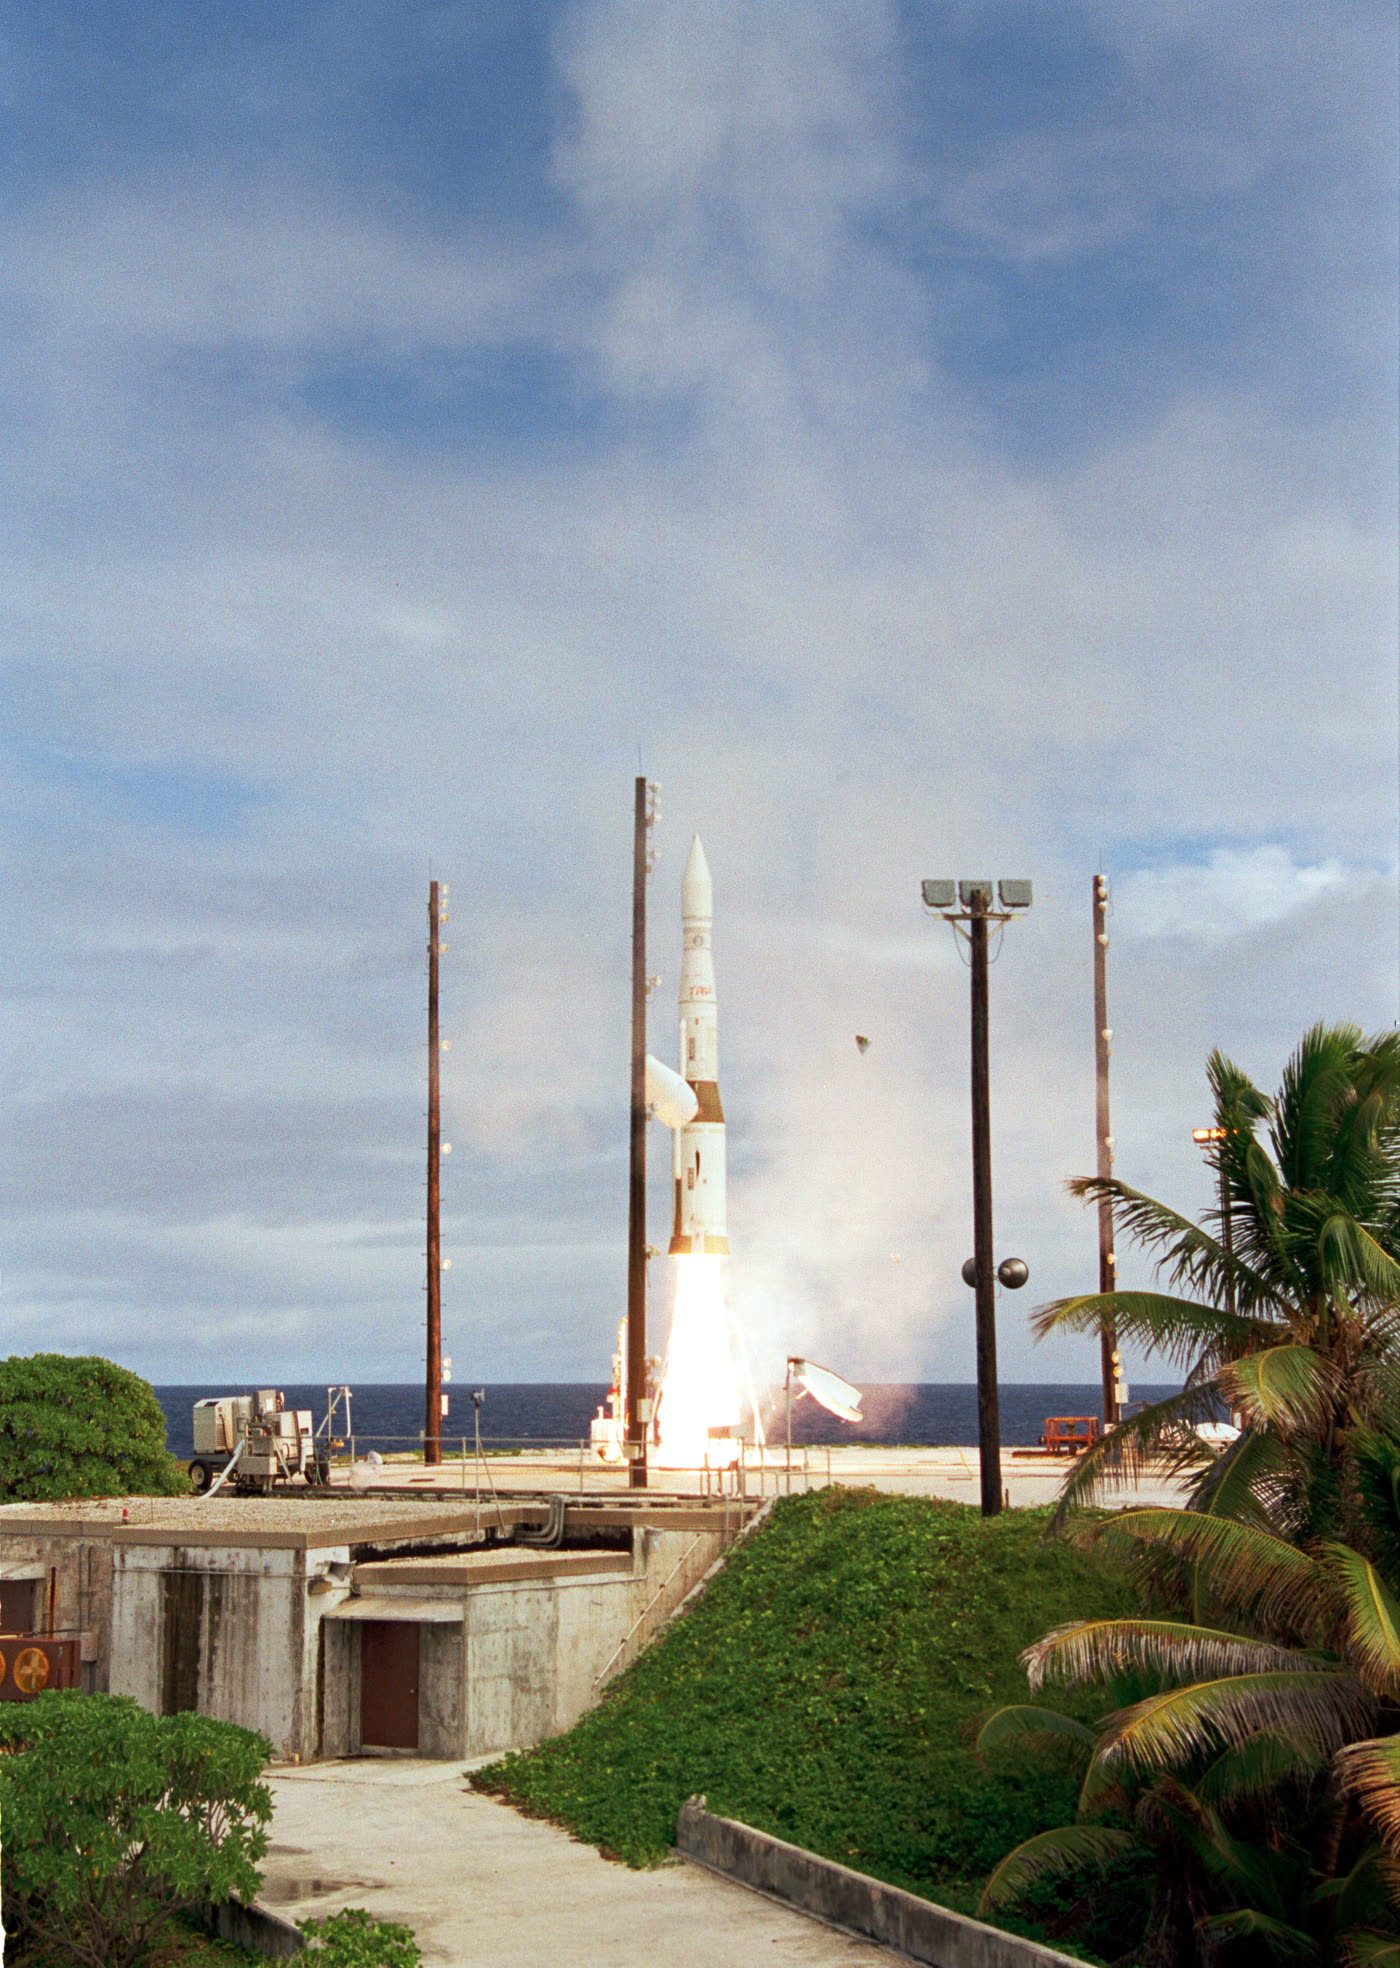
Dave Haasl, then at the Boeing Company, recognised the value of the method in 1963. A Boeing team led by Haasl then applied FTA to the entire Minuteman missile system, in work that began in 1964. Haasl developed the construction methodology and rules which, in the words of C. A. Ericson's 1999 history of the method, have been followed "almost implicitly by everyone in the industry", and later, as a private consultant, helped train most of the industry in the method. Other Boeing divisions saw the Minuteman results and began using FTA in commercial aircraft design from about 1966. The method's early history runs from the study of one function, Minuteman launch control, to the whole missile system and then to aircraft design.
In June 1965 Boeing and the University of Washington sponsored the first System Safety Conference, in Seattle, where several of the first technical papers on FTA were presented, among them Mearns's Fault Tree Analysis: The Study of Unlikely Events in Complex Systems. The conference is recorded as the start of worldwide interest in the method.
Adoption
Following the aerospace lead, the nuclear power industry adopted FTA in the 1970s. It may have contributed more to the method's development than any other single group of users: many new evaluation algorithms, and software using them, were developed there. In nuclear power and in NASA's programmes, FTA was used in safety studies and accident reviews: the mid-1970s Reactor Safety Study, WASH-1400, made extensive use of fault trees; after the Three Mile Island accident in March 1979 several accident review studies used them; and after the Challenger accident in January 1986 an independent review team used fault trees to evaluate the main engines.
Handbooks, regulation and standards followed. The US Nuclear Regulatory Commission published its Fault Tree Handbook, NUREG-0492, in 1981; NASA later produced an aerospace-oriented revision. Following process industry disasters including Bhopal (1984), the US Occupational Safety and Health Administration (OSHA) process safety management standard of 1992, 29 CFR 1910.119 (Title 29 of the US Code of Federal Regulations), lists FTA among the methodologies for process hazard analysis. FTA is also described in MIL-HDBK-338B, the US military electronic reliability design handbook, and in IEC 61025.
Summary
FTA defines one undesired top event and works backwards through AND and OR logic to the combinations of faults that produce it. Its minimal cut sets state how the top event can occur, and quantification ranks the causes so that effort goes where it is best spent. In functional safety it is one of the Boolean models used to calculate the probability of failure of a safety function, and it is used in SIL determination where LOPA becomes cumbersome. It covers one top event per tree and only the faults the analyst assesses to be realistic, and it is used alongside inductive methods such as FMEA to get a complete set of accident sequences.
Referenced standards
- IEC 61508-6, Part 6 of IEC 61508: Guidelines on the application of IEC 61508-2 and IEC 61508-3.
- IEC 61025, the international standard on fault tree analysis (FTA).
- MIL-HDBK-338B (1998), the US military Electronic Reliability Design Handbook, which includes a section on fault tree analysis.